
On an equipment-room project, what the customer cares about at the start is often very specific: whether utility power has been interrupted, whether the UPS is normal, whether a distribution circuit is abnormal, whether the air conditioner is running, whether temperature and humidity have gone out of limit, and whether water leaks and access control can be found in time. These questions concern business continuity, and they are the most solid starting point for power and environment monitoring.
After the project has been running for a while, managers keep asking: how much electricity did a site use in a day? How much of that is air conditioning, and how much is the IT load? Is equipment running inefficiently for long periods? Under the same environment and load, why is energy use higher than last month? After an operating strategy was changed, is the energy-saving effect real, and can it be sustained? At that point, the value of power and environment monitoring is no longer only “whether the equipment has an alarm.” It also extends to energy data and operations improvement.
The wider scope described here does not mean equipment-room power monitoring is replaced by energy management. It means joining the existing equipment-status data, step by step, with metering, operating, and maintenance information. The U.S. Department of Energy describes an energy management information system (EMIS) as made up of equipment, data services, and software, used to monitor, analyze, and control building energy use and system performance. Its capabilities can cover interval metering, fault diagnosis, data visualization, improvement verification, and operations optimization. U.S. Department of Energy: EMIS capabilities This matches the management path on site from “watching equipment” toward “watching system performance.”
The “power” in power and environment monitoring is widening
Traditional equipment-room power and environment work focuses on facility objects such as power supply and distribution, UPS, batteries, precision air conditioning, temperature and humidity, water leaks, access control, and fire-related monitoring. Its first goal is to protect the equipment-room operating environment and the critical power path, and to find abnormalities and notify the person on duty in time.
In campus, building, and distributed-site settings, the infrastructure boundary may keep widening. Beyond power supply, distribution, and cooling inside the equipment room, the work may also touch public-area distribution, HVAC, pump rooms, lighting, renewable energy, energy storage, or charging facilities. Which objects are brought into monitoring depends on project scope and management responsibility. A platform being able to connect data does not make every piece of equipment the responsibility of the same system to control.
Public industry information shows a similar direction. The Forge Plant Cognition project Honeywell released in October 2026, aimed at the Dangote refinery, proposes combining real-time operating data, process knowledge, AI capability, and a digital twin to find operating constraints and support equipment and process decisions. Honeywell press release A refinery and an equipment room are not the same kind of site, and the benefits cannot be compared directly. What it reflects as an industry direction is that infrastructure data is increasingly used to understand equipment, systems, and operating performance, not only to generate single-point alarms.
Seeing the equipment, and also seeing energy use clearly
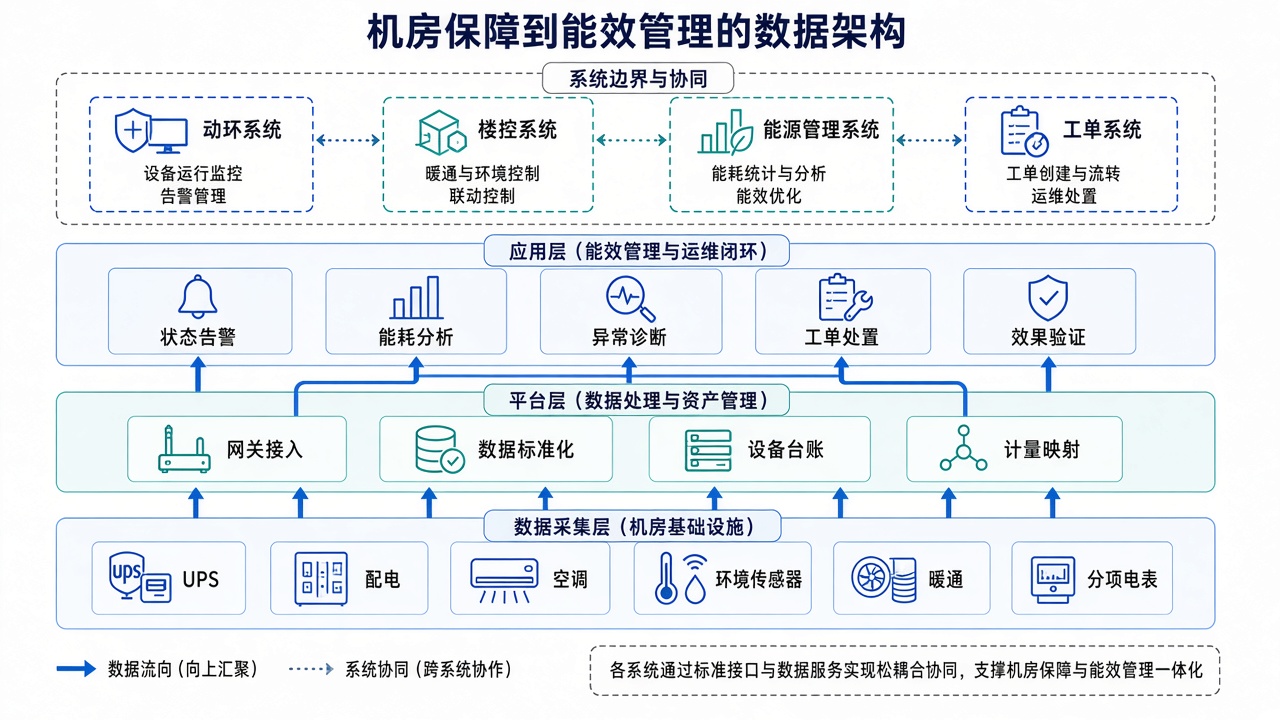
To use power and environment data for energy-efficiency management, at least three kinds of data have to be matched to one another.
The first kind is equipment status. It includes switch state, operating mode, fault state, temperature, pressure, valve position, equipment start-stop, and run time. It shows whether the equipment is working, and how it is working.
The second kind is energy metering. It includes the main incomer, electrical sub-metering, electricity use of key systems or equipment, and, where applicable, metering of water, gas, cooling, and similar quantities. With only the main meter, the usual view is the overall trend. To locate air conditioning, power, or an area, sub-metering has to be arranged reasonably, with the metering boundary and meter ownership made clear.
The third kind is operating conditions and management information. It includes outdoor weather, equipment-room load, building schedules, area use, duty and maintenance records, improvement measures, and the time those measures were put in place. Without this background, the platform may misread a seasonal change, a shift in occupancy, or a change in business load as an energy-efficiency abnormality.
After the data is aligned, a few more useful questions can be answered step by step: Is the equipment running to plan? Has energy use per unit of load departed from the baseline and stayed there? Is abnormal energy use related to an equipment fault, a control strategy, or run time? After a measure was taken, did the indicator recover? U.S. Department of Energy EMIS material also stresses that energy analysis, automated fault detection, improvement verification, and operations optimization can work together. A real diagnosis has to understand metering data and system operating status together. U.S. Department of Energy: EMIS and building operations data
From power and environment data to an energy-efficiency loop
The first layer is operating assurance: collect critical equipment status reliably, find power loss, equipment faults, temperature and humidity limit exceedances, water leaks, and communication abnormalities in time, and make sure alarms have an owner and a response process.
The second layer is energy visibility: establish the relationship between the main meter and sub-meters, and view energy trends by building, area, system, or equipment. Make meters, multipliers, timestamps, metering boundaries, and data quality accurate first, and only then discuss energy benchmarking and analysis.
The third layer is abnormality diagnosis and operations improvement: combine equipment status, energy curves, weather, and operating schedules to identify possible abnormal operation, control deviation, and energy-efficiency opportunities; assign the problem to the responsible team and record the inspection and adjustment process.
The fourth layer is result verification and continued operation: after a measure is in place, compare operating performance under the same load, similar weather, or a reasonable baseline, confirm whether the change came from the improvement, and bring the practices that work into the daily operating strategy. U.S. Department of Energy guidance on EMIS operations also stresses that analysis results should enter the organization’s standard process, that the effect still needs to be verified after an improvement, and that the system and the documents need to be maintained as the building and the way it operates change. U.S. Department of Energy: EMIS operations support
This process is not “the platform saves energy automatically.” The platform can find trends, provide diagnostic clues, and generate alarms or work orders. Strategy changes, equipment control, energy-saving calculations, and operating responsibility still have to be completed together by the corresponding specialist teams, control systems, and management processes.
Platform boundaries and implementation order
Power and environment monitoring, building automation, energy management, and equipment management share some data, but their duties differ. Power and environment work covers operation and alarms for critical power and environmental facilities. Building automation covers monitoring and control of building mechanical and electrical systems. Energy management covers metering, analysis, performance, and improvement. The maintenance management system takes equipment records, work orders, spare parts, and maintenance records. Implementation has to make clear where data comes from, who maintains it, who has control permission, and who handles an abnormality, so the site does not end up with “everyone can see it on the screen, and nobody owns the problem.”
A practical sequence is to start with one site or one class of system: choose the metering boundary and the critical equipment, and check collection quality; then build a view that links equipment status and energy use; then pick high-frequency abnormalities or high-energy objects and trial diagnosis and work-order close-out; finally, review the effect with a consistent baseline and consistent indicators. The energy baseline, metering accuracy, sub-meter coverage, and business load all affect the result. When an energy-saving effect is published, state the accounting basis, and do not treat an estimate as a verified benefit.
From equipment-room assurance to energy operations
The foundation of power and environment work is still reliable monitoring and timely response. Energy analysis has a credible starting point only when the data is real, equipment relationships are clear, and someone owns the alarms. As monitoring scope and metering capability are filled in step by step, power and environment data can extend from protecting equipment-room operation to understanding how building and campus equipment uses energy, where operation is unreasonable, and whether an improvement worked.
Tongwei Smart’s power and environment, building, and energy-management solutions can be joined step by step along equipment status, metering analysis, and operations close-out. For an owner, making the data and the response process solid at one site, then expanding to more systems, is more likely to produce a result that can be verified than pursuing a “large and complete” energy-efficiency platform from the start.